
Raspberry Pi Temperature Logger DS18B20
Digital temperature sensor DS18B20 are very popular among hobbyist because they are quite cheap, provide satisfactory precision for number of applications and can be easily interfaced with micro-controllers or Raspberry Pi. In this tutorial we will learn about Raspberry Pi Temperature Logger DS18B20. We wrote simple python script which gets sensor readings from DS18B20 sensors every 2 seconds and store the readings to an excel file.

In this article we are going to explain how to connect Raspberry Pi Temperature Logger DS18B20 using python code and periodically measure temperature with DS18B20 sensor that is attached to Raspberry Pi. This is quite common situation in number of different applications (like house monitoring, drying process monitoring, etc.). The measured values are stored in a excel file for later examination.
The most popular are those in TO-92 package as shown in image below. The sensors has three pins: VDD, GND and DQ (data input/output line). The power supply range is between 3.0 V and 5.5 V so can be easily interfaced to the 5V and 3.3V micro-controllers. In addition, it can be powered from DQ line (parasite power) so only two wires are needed. For communication with the sensor over DQ line 1-wire protocol is used. Therefore, you can connect number of sensors on same line.
Technical Specification
- Temp range -55°C to 125°C range
- Operating voltage 3V to 5V
- ±0.5°C over the range of -10°C to +85°C
- Sampling 750 ms
- 0.5°C (9 bit); 0.25°C (10 bit); 0.125°C (11 bit); 0.0625°C (12 bit) resolution
- 64 bit unique address
- One-Wire communication protocol
Materials Required
Below components are needed for this tutorial
- Raspberry Pi any model [BEST BUY]
- DS18B20 Sensor (Best Buy)
- Resistor 4.7KΩ
- Jumper cables [BEST BUY]
- Breadboard (Best Buy)
Connection
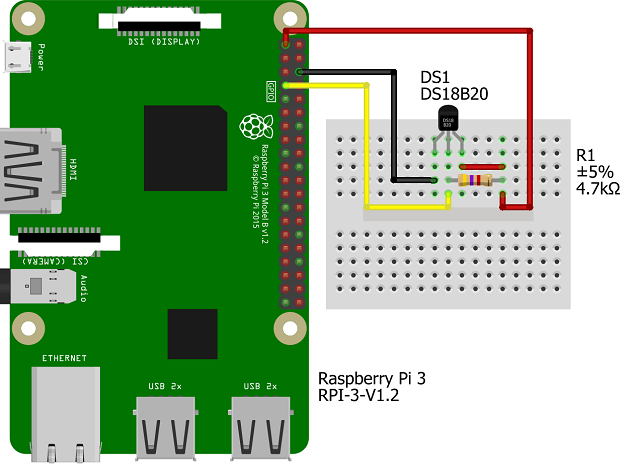
When connecting multiple sensors to device like microcontroller or Raspberry Pi, the sensors should be connected in a bus like fashion. Basically, this means that one cable with three wires is deployed and the sensors are attached to it at desired locations. Each sensor should be connected to the bus with wires as short as possible. In 1-wire communication, the bus is in idle state at high level. Therefore, you have to connect pull-up resistor (4.7K) between VDD and DQ line.

In our setup we have connected one DS18B20 sensors to Raspberry Pi. The above diagram shows how to connect more than one sensor on a single bus. The three wires which are connected to the 3.3V, GPIO4 and GND pin on Raspberry Pi GPIO header and to appropriate pins of each sensor. Pull-up resistor of 4.7KΩ is connected between 3.3V and GPIO4.
Here we will be using a single sensor just to demonstrate this tutorial.
Checking the 1-wire DS18B20 connectivity
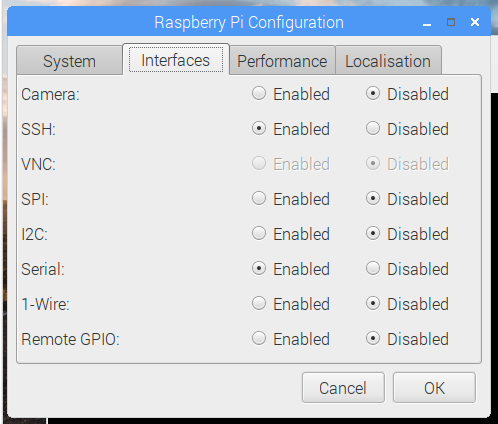
First you need to enable 1-wire interface in raspberry pi from the configuration. Locate Raspberry Pi Configuration from start and go to Interface tab. Click on enable before 1-Wire and click on OK. A reboot is need to enable this change.
Now lets quickly check if the raspberry pi is able to talk with the sensor. Open the Terminal in your raspberry pi and copy paste the command below.
sudo modprobe w1–gpio
modprobe w1-gpio : This command will register the new sensor which is connected to GPIO4. This will allow the Raspberry Pi to knows that there is a 1-Wire device connected to the GPIO pin.
modprobe is a Linux based program used to add a loadable kernel module (LKM) to the Linux kernel or it is also used to remove a LKM from the kernel. It enables to load drivers for automatically detected hardware connected with raspberry pi.
Then run the command below
sudo modprobe w1-therm
modprobe w1-therm: This command informs Raspberry Pi to add the feature to measure temperature on the 1-Wire device connected.
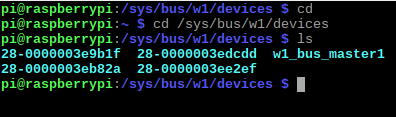
Now change directories to the /sys/bus/w1/devices directory by entering command below
cd /sys/bus/w1/devices
Now enter ls to list the devices:
ls
This command will show the list of contents present in /sys/bus/w1/devices. Here it will also include a number of directories starting with “28-“. The number of directories should be equal to the number of sensors connected with pi. There will be a syntax for every sensor ID connected starting with “28-“. Its a unique serial number of each of the DS18B20 sensors connected.
Then we will move inside one of those directories. Change “xxxxxxxxxxxx” to match the serial number of one of the directories
cd 28-xxxxxxxxxxxx
Now we are then going to see the file and its content named ‘w1_slave’. We will be using cat command view it.
cat w1_slave
The cat command helps us to get the by default results of the file in the screen. There are different options for cat command and for more you can check here. The output for the cat command should look as shown below.
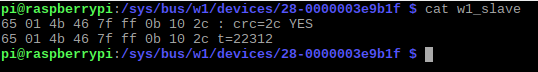
We see crc=2c YES for a successful CRC check (Cyclic Redundancy Check) at the end of the fist line. This indicates the connectivity between raspberry pi and sensor is good. In case you get a response like NO or FALSE or ERROR, which indicates the connectivity has not established yet and needs a recheck. As part of troubleshooting we need to check the circuit connections.
In the second line we can see the current temperature. The t=22312 is showing as the temperature is 22.312 degrees Celsius. We need to divide the reported value by 1000 to get the correct value. Now to convert the value from degrees Celsius to degrees Fahrenheit we have to use a simple formula. We have to multiply temperature in C by 1.8 and then add 32 to it.
Must Read:
- DHT11 Data Logger using Raspberry Pi and Python code
- Controlling ESP32 via Bluetooth using Blynk
- Raspberry Pi PICO with Thonny IDE
- How to install Raspbian Lite on Raspberry Pi Zero W
- Connecting DHT11 Sensor with Raspberry Pi 4 / 3 using Python
- Send DS18B20 Temperature Sensor data to ThingSpeak
- IoT based Timer Switch using Blynk and NodeMCU
Installing Python libraries
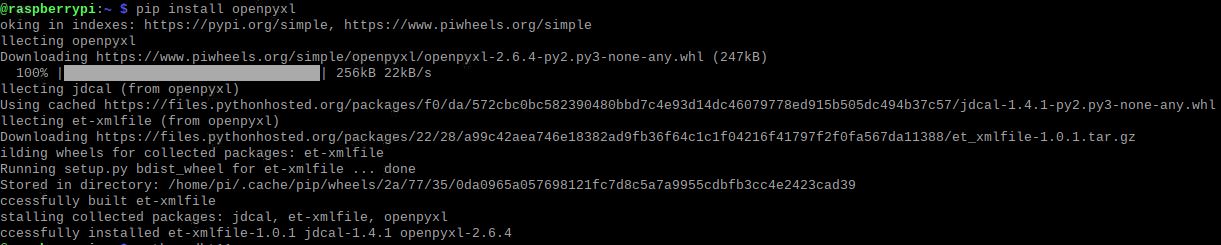
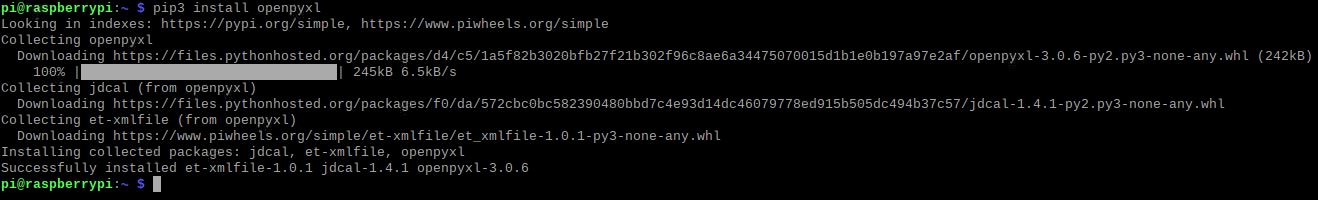
Let’s first install the required libraries for python code to run. Copy paste the below command to install openpyxl. Its a Python library to read/write Excel 2010 xlsx/xlsm files using python code.
pip install openpyxl
pip3 install openpyxl
Code
You can download the code and the excel file from the link below. After download unzip the file and copy paste the file in \home\pi directory.

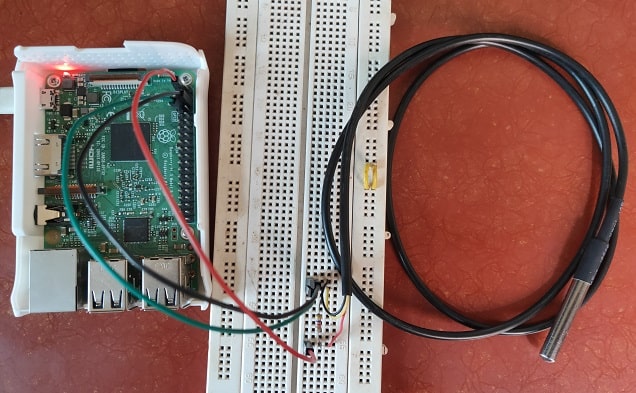
Building & Testing
We have connected the sensor with raspberry pi as per the connection diagram.
Once all the connection and code is in place you can execute the python code as shown below using terminal window. It will give you output in both the units.
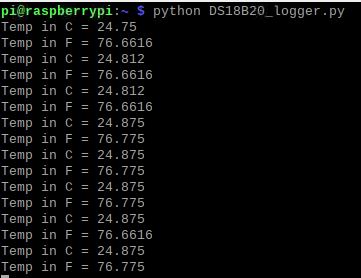
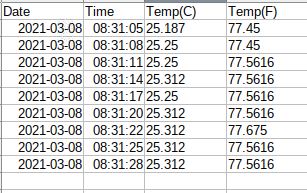
After stopping the code in terminal, if open the excel file you will get the temperature readings logged with date and time.
Conclusion
This is a tutorial on data logger where we are logging the temperature readings from the sensor. We are also dumping it in a excel file with date and time. Beginners can try this project and understand the concept of data logger with the communication between raspberry pi and DS18B20 temperature sensor.
Thank you for this tutorial! The timing was literally perfect!!
How can I purge (drop) rows after a certain number of days? For my project, I intend to take a measurement every 60 seconds to set a relative fan speed. But I need to monitor the temps to ensure the fan speeds are efficient because unnecessarily higher fan speeds = excessive noise + wasted money on electricity, but too low and heat will damage the equipment. At 1,440 entries per day, the log will get very long, very fast…and when I’m analyzing the data, I will not need to know the temps from 2 months ago.
I’m guessing this can be done with a cron job every 3 days that utilizes Pandas (which I just learned about yesterday)? All of the Pandas’ examples I can find either don’t have anything to do with a number of days and most examples work with fixed sets of data to establish a dataframe. Instead of getting the total number of rows, then filtering anything older than three days…it could also simply delete the first 4,320 rows (starting at row 2 and ignoring any errors when < 4,320 rows).
Any help you can offer on purging old data would be greatly appreciated!!
What OS are you using, just any version of Linux?
We are using Raspbian which comes with raspberry pi